How to create relationships in Power BI
If you’ve worked with multiple tables and had trouble with filters and slicers not producing the results you expect, it might not exactly be an error on your part. When combining data from multiple tables, Power BI relies on relationships between those tables. If there are no relationships or if you haven’t created the right relationship, your visual will most likely return an error. These errors can cause a lot of frustration and be difficult to fix.
In this tutorial, we’ll discuss what Power BI relationships are, how Power BI sometimes automatically creates them for you and how you can create them manually.
SEE: Hiring kit: Microsoft Power BI developer (TechRepublic Premium)
I’ll be demonstrating using Microsoft Power BI desktop on a Windows 10 64-bit system, but you can also use Power BI service for this task. To follow along, you can download the demonstration .pbix file here or work with your own data. This file contains three tables from Adventure Works Sales, which you can download from GitHub.
Jump to:
What relationships are in Power BI?
If you’re designing dashboards in Power BI and you’re not familiar with relationships, you’re at a disadvantage. Relationships between Power BI tables are important for pulling data together in meaningful ways for visuals. For instance, if order data and customer data are stored in separate tables — as they should be — you can’t reconcile an order to a specific customer without a relationship between the two tables.
SEE: How to create a field parameter in Power BI (TechRepublic)
Think of these relationships as you would your family relationships. You have a parent who may have other children. The relationship between you and this parent is a one-to-one relationship because there’s only one parent and one you in the equation. However, the relationship between your parent and all their children represents a one-to-many relationship.
There are three main types of relationships to consider when working in Power BI. Don’t worry too much about understanding these three types of relationships, because Power BI usually does a great job of taking care of relationships for users. However, a basic understanding will help for those times when you have to figure it out yourself.
One-to-one (1:1)
Both tables can have only one matching record on either side of the relationship. Most one-to-one relationships are forced by business rules and don’t flow naturally from the data.
One-to-many (1:*) and many-to-one (*:1)
One table contains only one record that relates to none, one or many records in the related table. This relationship is similar to the one between you and a parent who has several other children.
Many-to-many (*:*)
Each record in both tables can relate to any number of records — or no records — in the other table. These tables require a third table, known as an associate table, to relate the other two.
How to establish relationships when importing data in Power BI
The good news is that Power BI can interpret and create relationships when you import data. You can import any related data you like or work with the downloadable demonstration .xlsx file.
To import the demonstration tables, do the following:
- Open Power BI.
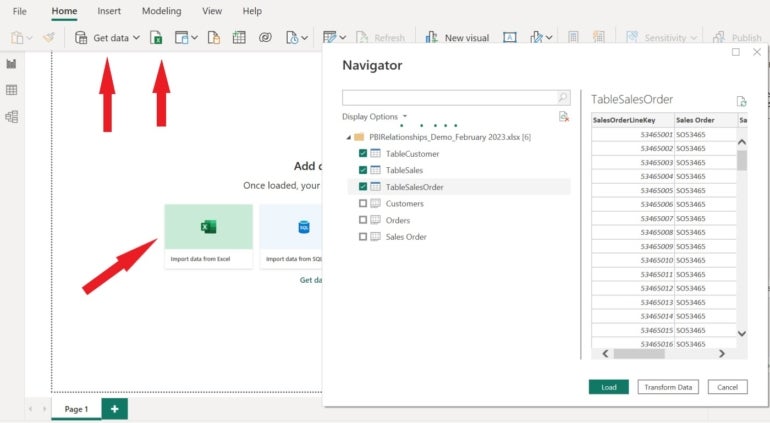
- In the Report window, click Import Data From Excel or use the Get Data dropdown and choose Excel workbook.
- In the resulting dialog, select the Excel file and click Open.
- The next window displays Excel Tables and sheets. This workbook contains three sheets, and each sheet contains an Excel Table. You can check either set, but not both, because they represent the same data. I recommend importing the Table objects (Figure A) because sheets might contain data you don’t want.
Figure A
- Click Load and wait. It might take a minute or two.
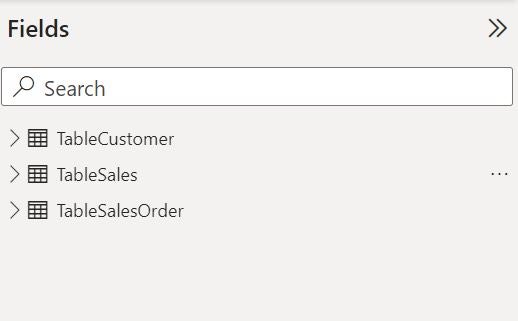
Figure B shows the tables in the Fields pane. Feel free to expand and review the fields or change the names if you want to. You won’t see any evidence of relationships here.
Figure B
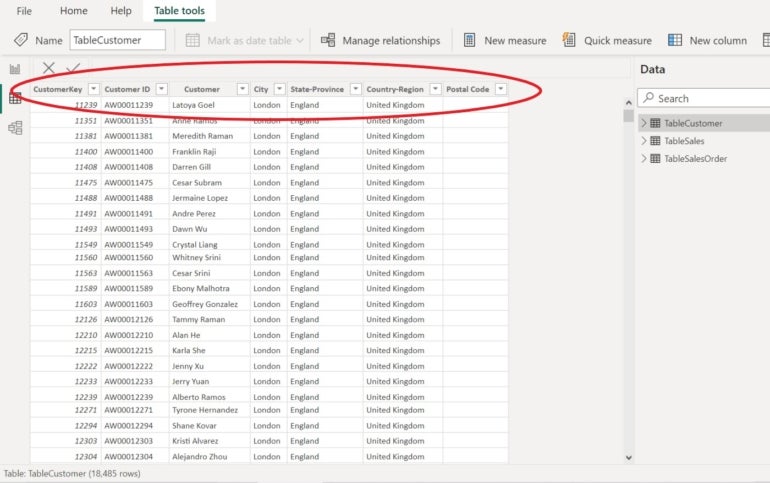
If you’re not familiar with the data, I recommend reviewing each table in the Data window. Figure C shows the customer table. This gives you the opportunity to review the column names and data types so you can match them to other tables when considering relationships.
Figure C
When you load the data, Power BI attempts to find and create relationships. It does so by comparing column names for potential matches. If it can’t find matching columns, it doesn’t create a relationship. In our case, Power BI did create a relationship.
How to view relationships in Power BI
To view or create a relationship, click the Model tab. As you can see in Figure D, Power BI created a relationship between two tables: TableSales and TableSalesOrder.
Figure D
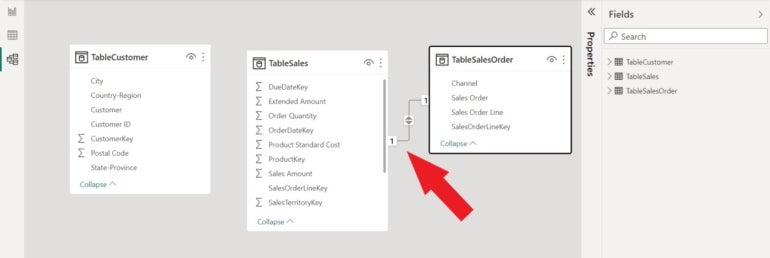
This happened automatically, but why? Power BI was able to create this relationship for two reasons:
- Both tables have a similarly named column.
- At least one of those columns contains only unique values.
To discover the type of relationship Power BI created, double-click the line between the two tables. The resulting window displays information about the relationship, as shown in Figure E. You can also edit the relationship. Notice that both tables have a column named SalesOrderLineKey.
Figure E
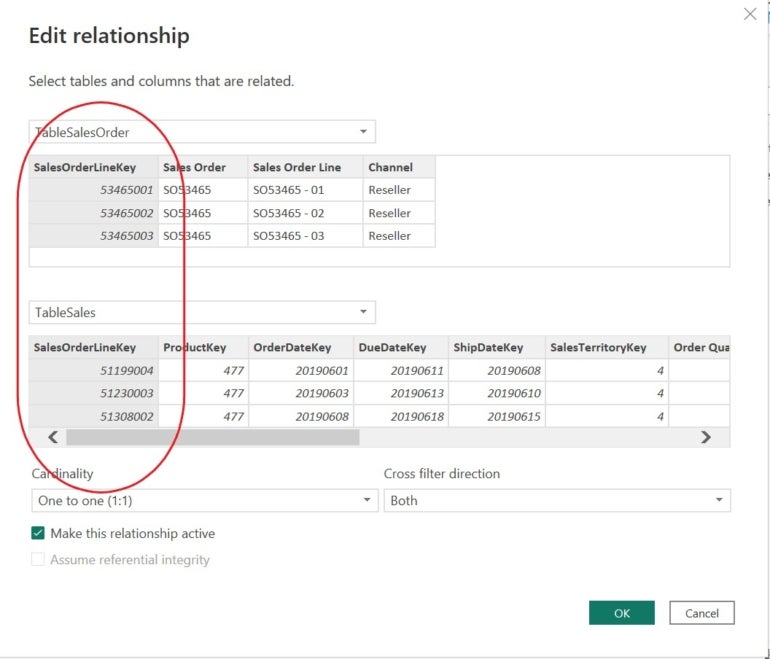
At the bottom, you can see that Power BI has created a one-to-one relationship based on the SalesOrderLineKey columns in both tables. That means there’s only one record in both tables where the SalesOrderLineKey value matches. Click OK and return to the Report window so we can base a simple visual on both tables.
To build the simple visual shown in Figure F, do the following:
- Click the Table visual in the Visualizations pane.
- In the Fields pane, expand TableSales and check Sales Amount and Total Product Cost.
- Expand TableSalesOrder and check Sales Order.
Figure F
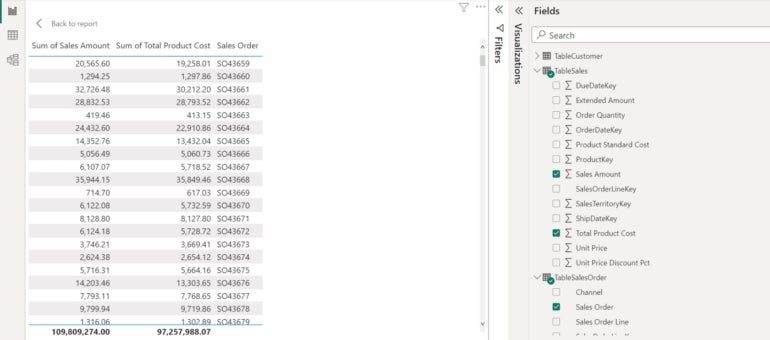
Without a relationship between the two tables, Power BI might let you build the visual, but it won’t display the data correctly. The many side — or the aggregate side of the visual — will display the same sum, average and so on for every record.
If you’re curious about these key fields, they’re not visible in visuals by default. You could add one to a visual, but in general, it won’t provide any meaningful information to the end user.
Rather, these values are helpful for identifying records uniquely. In relational database theory, they’re called primary and foreign keys. One side of the relationship must have a column of unique values. In a simpler dataset, you might use natural data, such as a customer name or a purchase order number to relate data.
How to create relationships in Power BI
After importing data and viewing the relationships Power BI has created, you might find that something’s missing. It’s possible that Power BI won’t detect all the relationships that should be shared between your datasets. When you think a relationship has been missed, use AutoDetect to find new relationships. This feature does exactly what it sounds like — it will try to detect new relationships.
Now, let’s run AutoDetect and see what happens:
- In the Report window, click the Modeling tab.
- Click Manage Relationships. This feature lists existing relationships.
- Click AutoDetect.
As you can see in Figure G, this feature didn’t find any new relationships, but don’t let that deter you from using this feature with your own data.
Figure G

Click Close twice to return to the Report window. Sometimes you have to create a relationship manually.
How to create Power BI relationships manually
When all else fails, you might have to create the relationship yourself. To do this, return to the Modeling window. As before, you see three tables and one relationship between two of them. We can’t create a relationship with TableCustomers, because there’s no common field with the other two tables. This is normal; some tables will have no relationships and some tables will have relationships with more than one table.
First, let’s delete the existing relationship and then recreate it. To delete, simply right-click the line connecting the two tables and choose Delete, as shown in Figure H. Then, click Yes to confirm the request.
Figure H
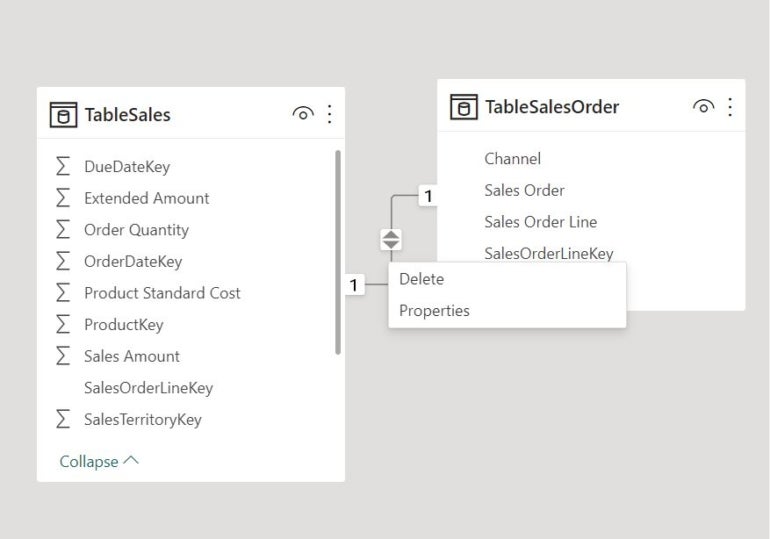
To recreate the relationship, click Manage Relationships and then click AutoDetect. This time, it finds and creates a relationship, as shown in Figure I.
Figure I
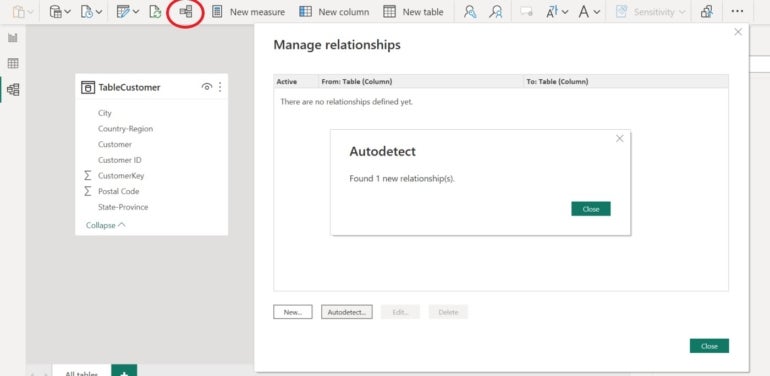
Click Close to confirm the relationship, as shown in Figure J. Then, click Close to return to the Modeling window.
Figure J

You can also create the relationship manually by dragging one field to another in the Modeling window. First, delete the relationship a second time and then do the following:
- Click the SalesOrderLineKey field in either table.
- Drag it to the same field in the related table and release it.
How to create Power BI relationships using AutoDetect
You can also use AutoDetect to create a relationship. To get started, delete the relationship a third time and then click AutoDetect. In the resulting dialog, do the following:
- Click New.
- From the first dropdown in the resulting dialog, choose one of the tables.
- In the second dropdown, choose the other table in the relationship. Power BI can now create the relationship (Figure K).
Figure K
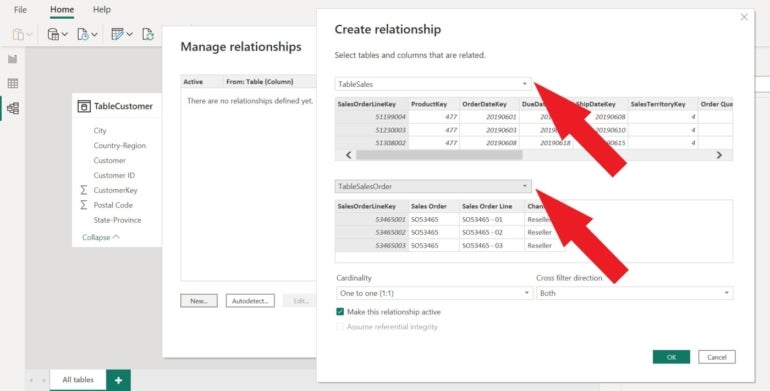
- Click OK and then Close to return to the Modeling window.
When troubleshooting the relationship that supports a visual when it’s not working as expected, temporarily change the visual to a table. Problems are much easier to find in a table visual.
Additional tips and tricks to establish Power BI relationships
If Power BI fails to create any relationships, check system options as follows:
- Click the File tab and choose Options and Settings and then choose Options to the right.
- In the resulting dialog, click Data Load under Current File.
- Check the Relationship options. The first and third options should be checked (Figure L).
Figure L

- Click OK to close the options dialog.
The second option is unchecked by default. This option, when enabled, looks for changes in the data source relationships as you refresh the dataset. Power BI will update its relationships if the underlying relationships have changed. This option is great when needed but is best left disabled.
SEE: Hiring Kit: Database engineer (TechRepublic Premium)
At this point, you have a reasonable understanding of what relationships between tables are and why they’re important in Power BI. You also know how to create them if Power BI fails to do so when data is imported.
Read next: Best business intelligence tools (TechRepublic)
For all the latest Technology News Click Here
For the latest news and updates, follow us on Google News.
