With self-learning models, prediction can be explained
Self-learning computer models can be of value for speech recognition, fraud detection, and assessing medical risks. However, the benefits scandal, for example, shows that the utmost caution must be exercised: and that is why the law stipulates that there must always be an explanation as to how a model reaches a certain conclusion. To help data experts with this, Ph.D. researcher Dennis Collaris has developed interactive visualization tools that offer insight into the “thought processes” of artificially intelligent models.
“It’s kind of taking over the world,” says Dennis Collaris about artificial intelligence (AI). And he is quite serious about this. “AI is being used for almost everything you can think of, especially to make predictions.”
The applications are often relatively innocent; think of speech recognition or machine translations. “If there’s a minor error in there, it’s not the end of the world. But of course, there are some applications, such as fraud detection, where a prediction by an AI system can have huge consequences for people. The benefits scandal has shown just how serious these consequences can be if you’re wrongly labeled a fraudster.”
Therefore, the European privacy legislation GDPR states that there must always be an explanation of how computer models arrive at a certain recommendation. However, that is very difficult when it comes to self-learning AI systems: it is a proverbial “black box” that spews out an answer based on a mountain of data, and the way it arrived at that answer cannot simply be traced.
The crux of the matter is that the computer model does not follow a well-defined step-by-step plan, but has gradually figured out for itself which features of—for example—potential insurance customers indicate the likelihood that they intend to commit fraud.
Motivation
The bottom line is that these self-learning models make demonstrably useful recommendations, but they do not provide any motivation, whereas motivations are required to reject someone for insurance, or to start a fraud investigation.
And “Computer says no” cannot be considered a valid reason. “At an insurance company like Achmea, which I collaborated with for my research, it takes data experts an awful lot of work to explain their prediction models,” Collaris points out. The Eindhoven graduate studied Web Science at TU/e’s department of Mathematics and Computer Science and graduated as part of the visualization group led by Professor Jack van Wijk, who then asked him to stay to pursue a Ph.D.
To find out what strategy a computer model has adopted, having a clear overview of the used and processed data is essential. To this end, Collaris developed two interactive software tools, “ExplainExplore” and “StrategyAtlas,” which offer users insight into the soul of self-learning models.

Groups
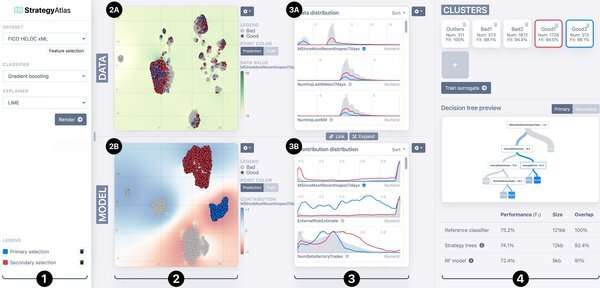
Among other things, StrategyAtlas looks for patterns in data, and in particular, shows how the model divides individuals into different groups (see image above).
In plot 2A, each dot represents an individual, and individuals who have similar features are grouped close together. Plot 2B shows these same individuals, but classified according to the weights the model assigned to these features. Each cluster of dots in this visualization corresponds to a “model strategy” that is used by a model to make a prediction: the model uses approximately the same features for all individuals in that cluster. The weights depend on the model’s objective (e.g., estimating whether a customer is a fraudster or a potential defaulter).
A self-learning model often has a very different view of the world than you would expect, the Ph.D. researcher emphasizes. This is evident from the visualizations in “StrategyAtlas.” “You can see that the red and blue groups, which the model perceives as very different, do not appear to be so based on the input data. Because in 2A, blue and red are all mixed together,” Collaris points out.
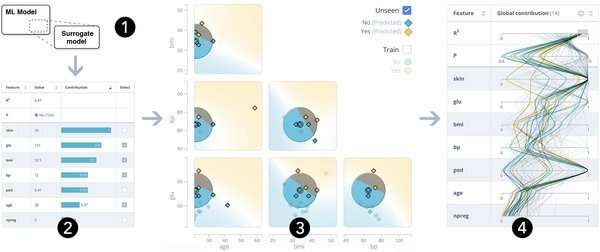
Collaris’ other software tool ExplainExplore very clearly indicates the weight of a particular feature in the model’s calculations for determining a prediction. “We call that the ‘feature contribution,'” says Collaris. As an example, he mentions predicting the risk of diabetes (see image below).

For each individual, the software shows the weight of each feature in its prediction (left, in this case: 28% chance of diabetes). Skin thickness (“skin”), blood glucose level (“glu”), and BMI were the most important factors. “If unexpected feature contributions emerge from this analysis, this could be a reason to take another critical look at the model, but in theory, an unexpected result could, of course, also lead to interesting medical insights.”
On the right, there are the feature contributions for other individuals in the dataset. This shows, for example, that the model generally places little importance on the number of pregnancies an individual has gone through, but also that there is a strikingly large variation in how much weight is given to the “pedigree” (a measure of how often the disease occurs in the family). Finally, the middle section illustrates how resilient the model is to small adjustments in values. “If skin thickness is so important, you wouldn’t expect skin thickness to suddenly become barely relevant to the prediction if the skin is just a little bit thicker or thinner.” The plots in the middle provide information about that, and thus say something about the reliability of the model.
Thesis cover
The cover of his dissertation also features a diagram with three bars, which Collaris created using ExplainExplore. Just for fun, he taught a computer model to predict which category a technical document belongs to, based on seventeen features. He then entered the pdf of his own dissertation. And sure enough: the result was: Ph.D. thesis. He already knew that, of course, but now he knows why. “The most important ‘feature contributions’ turned out to be the number of pages and the maximum height and width of the images. So apparently, that’s what makes my Ph.D. thesis a Ph.D. thesis.”
Building explainability into the components of machine-learning models
Citation:
With self-learning models, prediction can be explained (2022, July 7)
retrieved 7 July 2022
from https://techxplore.com/news/2022-07-self-learning.html
This document is subject to copyright. Apart from any fair dealing for the purpose of private study or research, no
part may be reproduced without the written permission. The content is provided for information purposes only.
For all the latest Technology News Click Here
For the latest news and updates, follow us on Google News.
